Every batch of a research peptide begins as a claim: a name, a sequence, a molecular formula on a label. Analytical chemistry is what turns that claim into evidence. Before a compound is suitable for reproducible laboratory work, two questions must be answered independently — is it what the label says it is? (identity) and how much of the sample is actually that molecule? (purity). Two complementary techniques dominate peptide characterization and answer these questions: high-performance liquid chromatography with UV detection (HPLC-UV) and liquid chromatography–mass spectrometry (LC-MS). This guide explains what each method measures, how to read the data they produce, and why a Certificate of Analysis (COA) that pairs them is the foundation of trustworthy research material.
Why identity and purity are separate questions
It is easy to assume that a highly pure sample must also be the correct compound, but the two properties are logically independent. A sample can be 99% pure and be 99% of the wrong molecule — a truncated sequence, a deletion analog, or a structurally similar impurity. Conversely, a sample can contain the correct target peptide but be diluted with counter-ions, residual solvents, water, or synthesis by-products, lowering its effective purity. Reproducible science depends on constraining both variables. HPLC-UV is the workhorse for quantifying purity; LC-MS is the definitive tool for confirming identity by molecular weight. Used together, they cross-check one another.
HPLC-UV: separating a mixture into peaks
High-performance liquid chromatography works by pushing a dissolved sample through a densely packed column under high pressure. In reversed-phase HPLC — the mode most common for peptides — the column's stationary phase is nonpolar (typically a C18-bonded silica), while the mobile phase is a polar mixture of water and an organic solvent such as acetonitrile, usually run as a gradient. Molecules in the sample partition between the two phases according to their hydrophobicity. More hydrophilic species elute quickly; more hydrophobic species are retained longer. The result is that a mixture entering the column as a single plug exits as a series of separated bands.
As each band leaves the column it passes a UV detector. Peptides absorb ultraviolet light — the peptide bond absorbs strongly near 210–220 nm, and aromatic residues (tryptophan, tyrosine, phenylalanine) add absorbance near 280 nm. The detector records absorbance over time, producing a chromatogram.
Reading a chromatogram
A chromatogram is a two-dimensional trace: time runs along the horizontal axis, detector response (absorbance) along the vertical axis. Two features matter most:
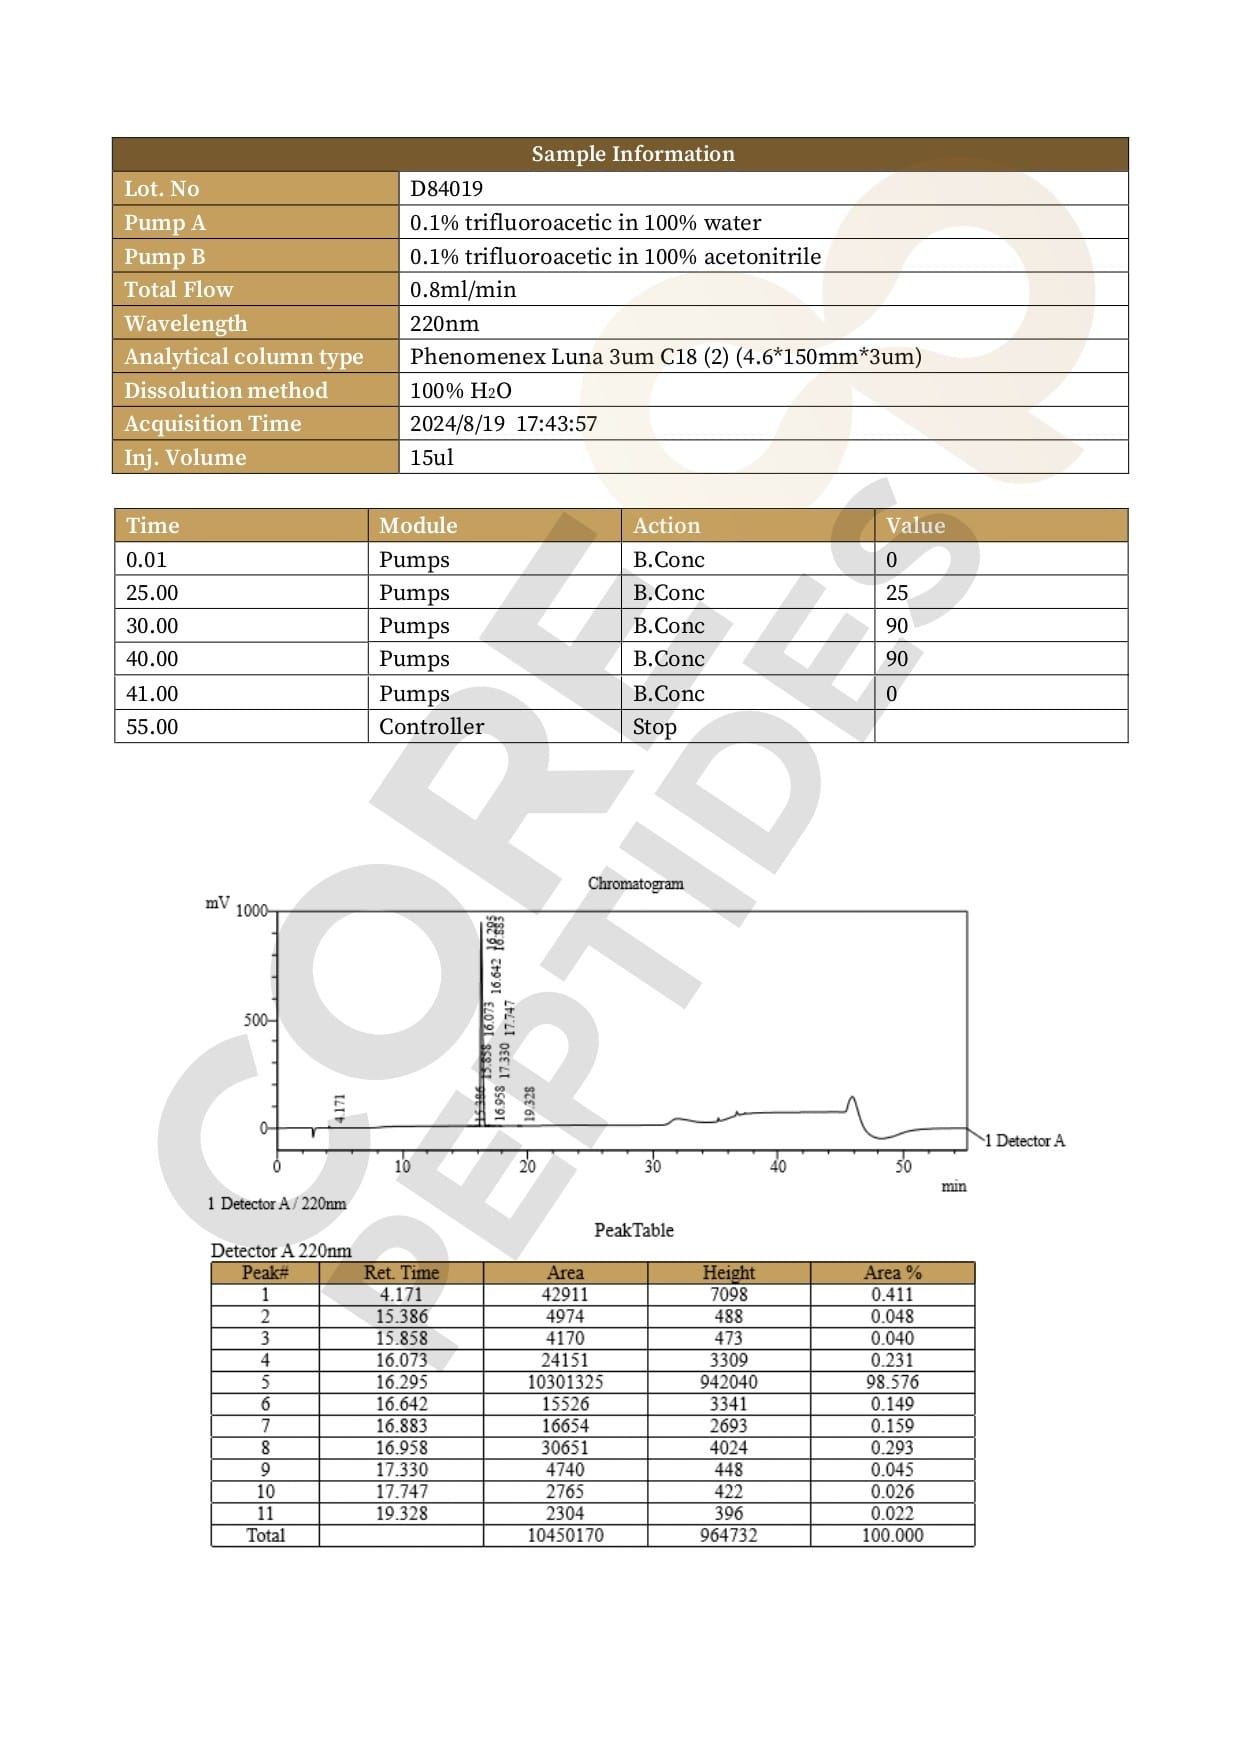
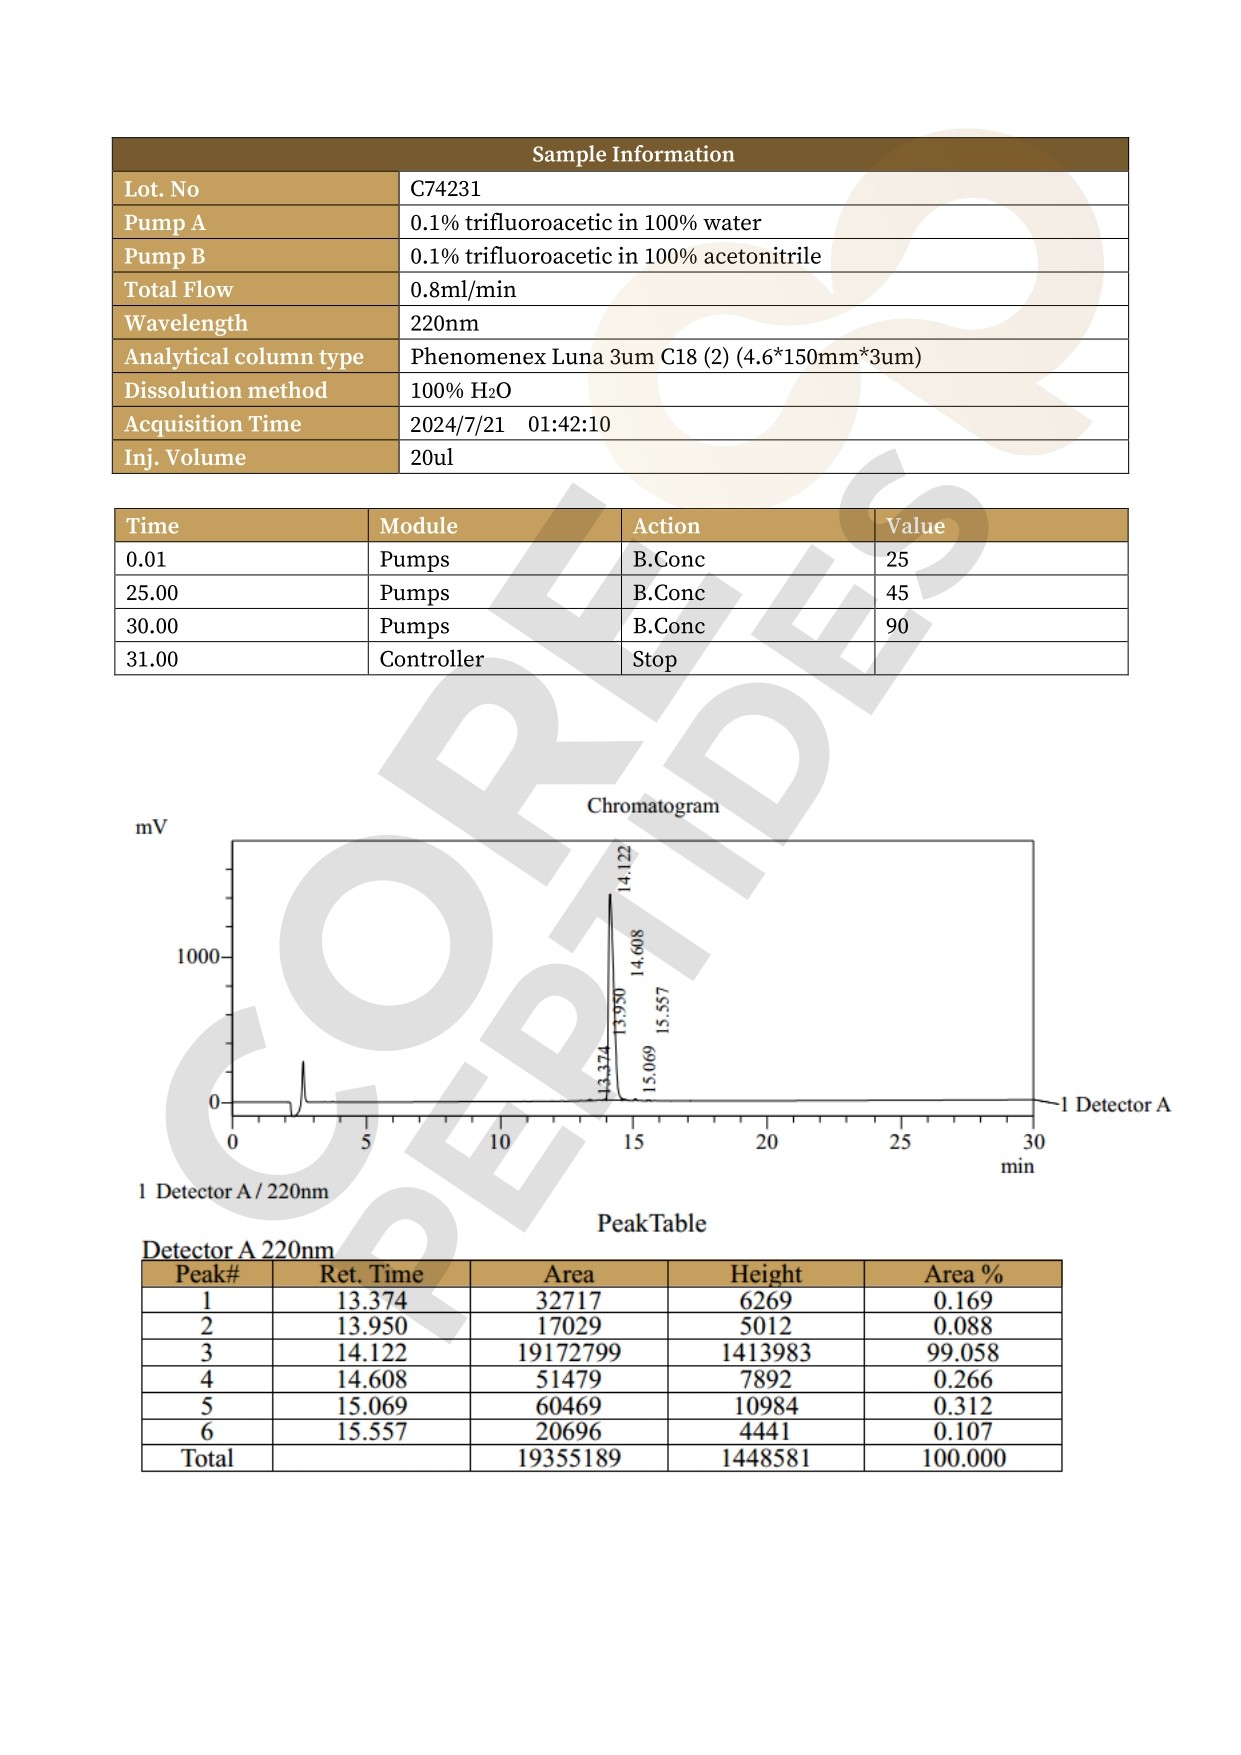
- Retention time — the time at which a peak appears. Under fixed conditions (same column, gradient, flow rate, temperature), a given compound elutes at a characteristic, reproducible retention time. It is a fingerprint for the method, not proof of identity on its own.
- Peak area — the integrated area under each peak, which is proportional to the amount of UV-absorbing material in that band.
Purity by HPLC-UV is reported as the main-peak area percent: the area of the target peak divided by the total area of all integrated peaks, expressed as a percentage. If the target peak accounts for 99% of the total integrated area, the sample is described as ≥99% pure by that method, at that wavelength. Small satellite peaks represent impurities — incomplete sequences, oxidation products, or process residuals.
Retention time tells you a peak is consistent; peak area tells you how much is there. Neither, by itself, tells you the molecule is correct — that is the job of mass spectrometry.
What ≥99% purity does and does not mean
A ≥99% figure is a statement about the proportion of UV-absorbing material attributable to the main peak. It is a rigorous, widely used metric, but it carries caveats worth understanding. UV detection only sees species that absorb at the monitored wavelength, so non-absorbing counter-ions or salts may not register. The number is also method-dependent: a shallower gradient or a different column can resolve peaks that a coarser method would merge. This is why a credible COA specifies the analytical conditions alongside the result — the value is only interpretable in context.
LC-MS: confirming identity by mass
Liquid chromatography–mass spectrometry couples the same separation power of LC to a mass spectrometer instead of (or in addition to) a UV detector. After the LC stage separates the sample, each eluting species is ionized — commonly by electrospray ionization (ESI), which imparts charge without shattering the molecule — and the instrument measures its mass-to-charge ratio (m/z). From the observed m/z values and their charge states, the software reconstructs the molecule's molecular weight.
This is the decisive identity test. Every peptide has a theoretical monoisotopic and average mass calculable directly from its amino acid sequence. When the measured mass matches the theoretical mass within the instrument's tolerance, the identity of the target is confirmed. A mismatch — a mass shy by the weight of one residue, or heavier by 16 daltons — flags a deletion sequence or an oxidation event that a UV chromatogram alone might not explain. LC-MS also characterizes the impurity peaks that HPLC-UV merely counts, turning an anonymous satellite peak into an identified by-product.
Why the two methods belong together
HPLC-UV and LC-MS answer different questions, and each covers the other's blind spot. HPLC-UV quantifies how much of the sample is the main component but cannot, on its own, prove what that component is. LC-MS confirms what the main component is but is not the primary tool for routine purity percentages. Run in tandem, they establish both the identity and the purity of a lot with cross-validating evidence. This pairing is the backbone of a meaningful Certificate of Analysis. For a walkthrough of how these results are documented, see our guide on reading a Certificate of Analysis, and for background on the compound class itself, see what research peptides are.
Lot-specific documentation and reproducibility
Analytical rigor is only useful if it reaches the researcher. That is why lot-specific documentation matters: when a lot is characterized by HPLC-UV for purity and by mass spectrometry for identity and ships with the corresponding COA, a laboratory can verify what it actually received rather than trust a generic specification. That traceability is a prerequisite for the reproducibility that serious research demands.
A quick reference
| Property | HPLC-UV | LC-MS |
|---|---|---|
| Primary question | How much is the target? (purity) | Is it the target? (identity) |
| Measures | UV absorbance vs. time | Mass-to-charge ratio, then molecular weight |
| Key output | Main-peak area % | Observed vs. theoretical mass |
| Sees impurities as | Extra peaks (counted) | Identifiable masses (characterized) |
Core Peptides supplies research peptides strictly for laboratory and in-vitro research use only. The analytical methods described here are provided for educational purposes to explain how research-grade material is characterized. Nothing in this article is medical, therapeutic, or dosing guidance, and none of these compounds is intended for human or veterinary use.